Profiler
Profiling your SQL queries and stored procedures can be a crucial but cumbersome task with the regular tools. Especially when you have stored procedures calling stored procedures etc. With EZSQLTools Profiler this is now much easier!
Trace Properties
General
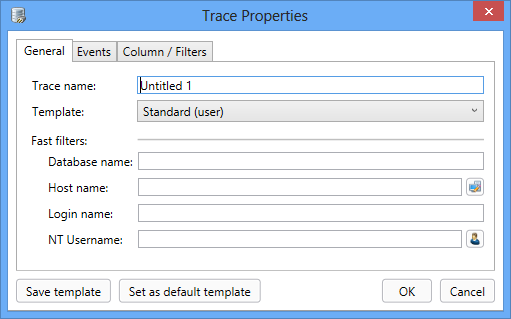
Quick start your trace by selecting your initial template and adding some fast filters. We often add filters for "Database name", "Host name", "Login name" & "NT Username". Why should these filters be hard to find? Buttons to auto-fill Host name & NT Username makes the usage even faster.
Quick start your trace by selecting your initial template and adding some fast filters. We often add filters for "Database name", "Host name", "Login name" & "NT Username". Why should these filters be hard to find? Buttons to auto-fill Host name & NT Username makes the usage even faster.
Events
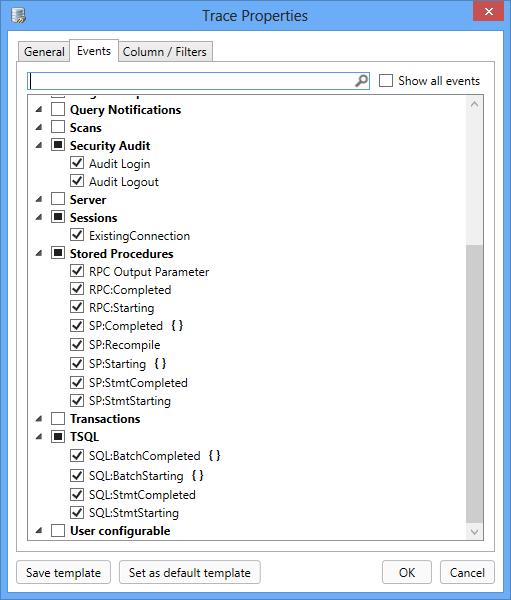
Easily locate the events you're really looking for using the filterbar. Notice the grouping {} icons behind some of the events. This indicates that we require both of the events to be able to group the traced events, thus checking/unchecking one event will automatically include/exclude the other one.
Easily locate the events you're really looking for using the filterbar. Notice the grouping {} icons behind some of the events. This indicates that we require both of the events to be able to group the traced events, thus checking/unchecking one event will automatically include/exclude the other one.
Profiling
General
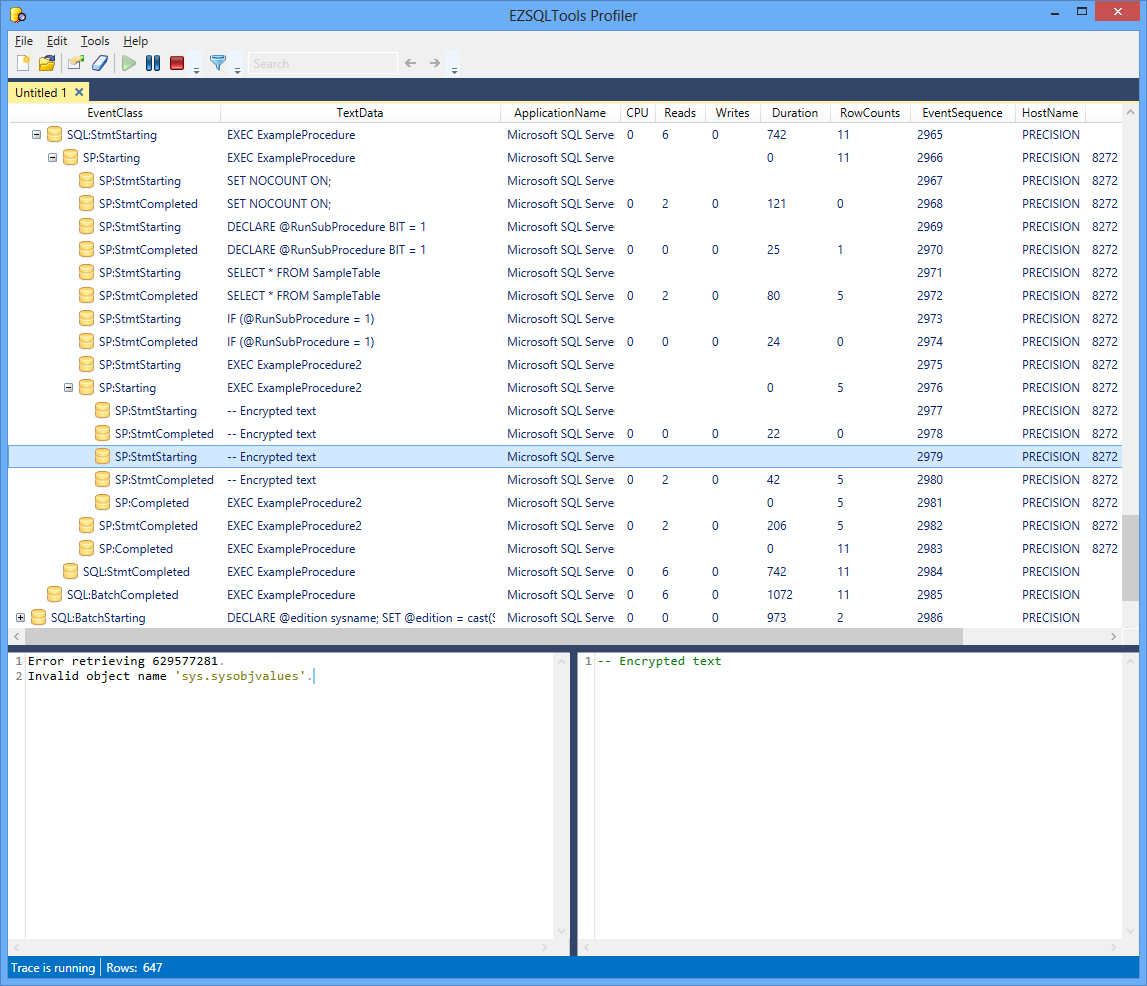
Already with your first profile you will see that there's a difference between EZSQLProfiler & your regular profiling tool. All queries is grouped by the eventclass so it's easy to see what a certain query did. For this reason we haven't added support for Microsoft SQL Server Profiler's grouping by columntype.
Already with your first profile you will see that there's a difference between EZSQLProfiler & your regular profiling tool. All queries is grouped by the eventclass so it's easy to see what a certain query did. For this reason we haven't added support for Microsoft SQL Server Profiler's grouping by columntype.
Queries
Clicking on a tracerow shows you the content of the query performed. Syntax highlighted of course. Pressing ctrl+f inside lets you search within the query itself.
Take a closer look at the screenshot to see how well all parts work together.
Clicking on a tracerow shows you the content of the query performed. Syntax highlighted of course. Pressing ctrl+f inside lets you search within the query itself.
Take a closer look at the screenshot to see how well all parts work together.
Stored Procedures
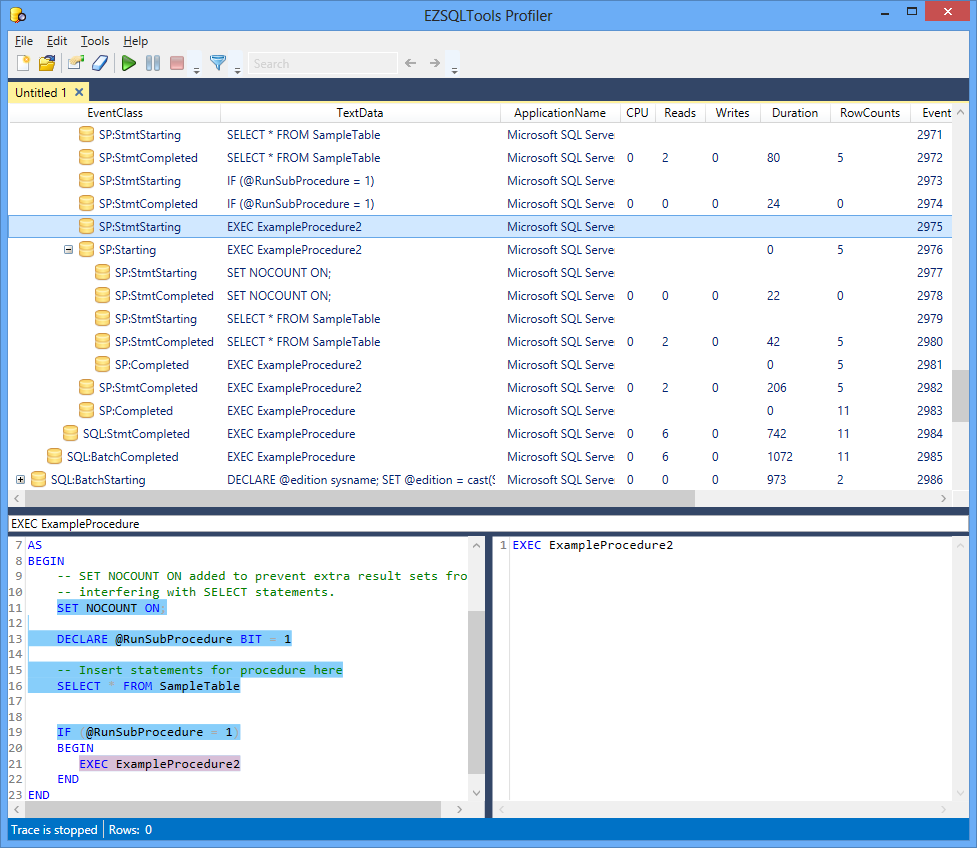
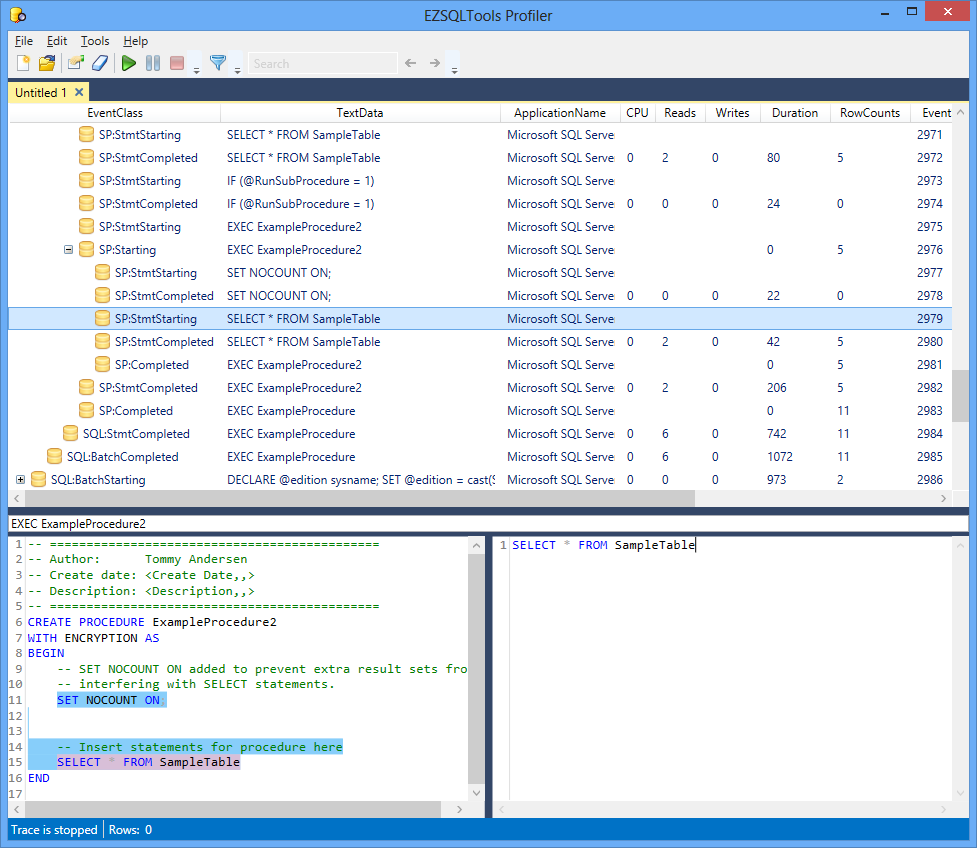
Stored procedures is grouped just like regular queries. If a stored procedure executed another stored procedure, this will be shown as a child query of the executing procedure, giving you a complete overview of how things is bound together.
Clicking on a tracerow executed by a stored procedure shows you the content of the query performed. The stored procedure is shown on the left of the query executed. The query performed will be highlighted in the stored procedure view. That is, all of the commands executed in the stored procedure will be highlighted, but the selected will be highlighted with a different color. This way you see exactly what the stored procedure did. If you have an if-then-else block in your procedure you will see which block that executed because it will be highlighted.
If a stored procedure is encrypted EZSQLProfiler will connect to the SQL server using DAC and try to decrypt it. This requires that you're connected to the sql server as an administrator and that DAC is enabled. (DAC can be enabled for remote machines as well. Click here to read how.).
Pressing ctrl+f inside the stored procedure lets you search within the stored procedure.
SQL Server support
Validated and tested with:
- Microsoft SQL Server 2016 CTP3.0
- Microsoft SQL Server 2014
- Microsoft SQL Server 2012
- Microsoft SQL Server 2008 R2
- Microsoft SQL Server 2008
- Microsoft SQL Server 2005
- Microsoft SQL Server 2000
- Microsoft SQL Server 7.0
